Welcome to gwsnr’s documentation!
gwsnr : Efficient Gravitational-Wave Signal-to-Noise Ratio Calculator
gwsnr is a Python package for fast and accurate gravitational-wave (GW) Signal-to-Noise Ratio (SNR) calculation. It is designed for semi-analytical Probability of Detection (Pdet) estimation in population simulations and for hierarchical Bayesian inference with selection effects. The package achieves a speed-up of more than 5,000x compared to traditional methods, while maintaining an accuracy above 99.5%.
gwsnr removes computational bottlenecks using advanced interpolation, Just-in-Time (JIT) compilation, and parallel processing. It provides multiple backends optimized for different hardware: numba for multi-threaded CPU performance, and jax or mlx for GPU acceleration.
With a simple API, gwsnr integrates smoothly into existing workflows. It is also used by the ler package (see ler documentation), which simulates detectable lensed and unlensed GWs. This allows researchers to include fast Pdet calculations (via SNR) with minimal overhead.
For a detailed technical overview, see the Summary section, and browse the topics under CONTENTS in the sidebar (or top-left menu) of your browser.
Quick Start
Install the package using pip:
pip install gwsnr
Then, compute the SNR for a binary black hole system:
from gwsnr import GWSNR

# Initialize the default calculator
gwsnr = GWSNR()

# Compute SNR and Pdet for a 30-30 Msun binary at 1000 Mpc with other random extrinsic parameters
snrs = gwsnr.optimal_snr(mass_1=30, mass_2=30, luminosity_distance=1000, psi=0.0, phase=0.0, geocent_time=1246527224.169434, ra=0.0, dec=0.0)
pdet = gwsnr.pdet(mass_1=30, mass_2=30, luminosity_distance=1000, psi=0.0, phase=0.0, geocent_time=1246527224.169434, ra=0.0, dec=0.0)

print(f"SNR value: {snrs},\nP_det value: {pdet}")
Note
gwsnr supports Python 3.10+ (but 3.11 recommended) and utilizes multi-core CPUs and NVIDIA GPUs (or Apple Silicon GPUs) when available. Refer to the Installation section for detailed setup instructions.
About the Project
Source Code: github.com/hemantaph/gwsnr
Issue Tracker: Report an issue
Main Developer: Hemanta Ph.
Contributor: Otto Akseli Hannuksela
Citation: If you use
gwsnrin your research, please cite the gwsnr paper.
Glossary
- Gravitational waves
Ripples in the fabric of spacetime, first predicted by Albert Einstein in his theory of General Relativity in 1916. They are created by some of the most violent and energetic events in the universe, such as the collision of black holes, the merging of neutron stars, or supernova explosions. These waves travel outward from their source at the speed of light, carrying information about their origins and the nature of gravity itself.
For a century, gravitational waves remained a theoretical prediction. It wasn’t until 2015 that the LIGO and Virgo collaborations made the first direct detection, an achievement that earned the 2017 Nobel Prize in Physics and opened an entirely new way of observing the cosmos.
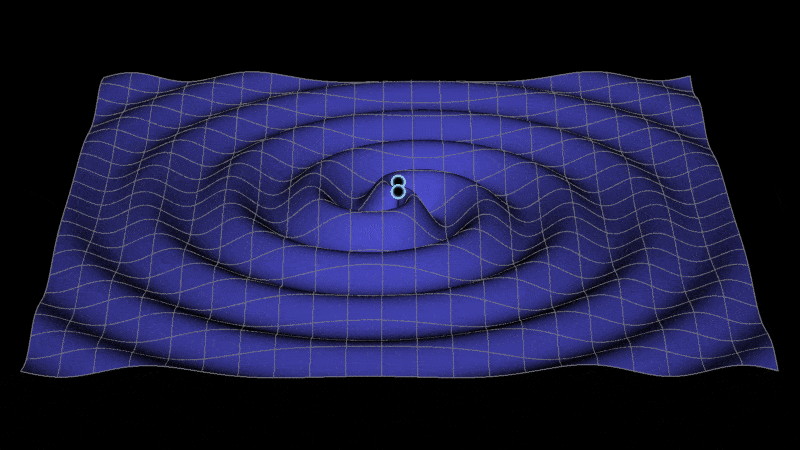
Animation showing the propagation of gravitational waves from inspiraling binary black holes. As the waves travel, they stretch and squeeze spacetime in their path. Source: Jeffrey Bryant, Wolfram | Alpha, LLC..
- Detection of gravitational waves
The effect of a passing gravitational wave is incredibly subtle. To detect these faint signals, scientists use enormous L-shaped instruments called laser interferometers. The most prominent detectors are the two LIGO observatories in the United States, the Virgo detector in Italy, and the KAGRA detector in Japan. These instruments use lasers to measure minute changes in the lengths of their kilometers-long arms—changes on the order of 1/10,000th the width of a proton.
Since gravitational-wave signals are extremely weak, they are typically obscured by the detector’s background noise. Scientists employ a data analysis technique called matched filtering to extract these hidden signals and compute the Signal-to-Noise Ratio. This process involves cross-correlating the noisy detector data with an extensive library of theoretical gravitational-wave templates. When the data containing a genuine signal aligns with a matching template, the SNR increases dramatically, creating a distinctive peak that indicates a potential detection once it exceeds a pre-determined threshold.
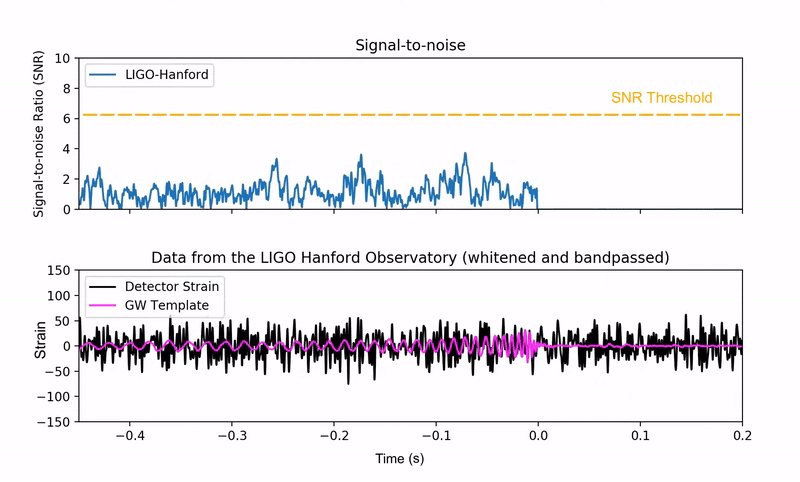
Animation of the matched filtering technique. The bottom panel shows a theoretical gravitational-wave signal (pink) scanning a hidden signal within noisy detector data (black). The top panel shows the Signal-to-Noise Ratio (SNR) calculated from this data. A confident detection is claimed when the SNR forms a sharp peak that crosses a pre-defined threshold (yellow dashed line). Source: Alex Nitz | YouTube.
The
gwsnrpackage efficiently computes this critical quantity for large-scale astrophysical simulations. Unlike detection pipelines such asPyCBCandGstLAL,gwsnris optimized for rapid SNR calculation across thousands or even millions of gravitational-wave simulated events in population studies.
Contents:
- Installation
- Code Overview
- Summary
- Performance Summary
- Noise-Weighted Inner Product Method
- Detection Statistics of Gravitational Waves
- Matched Filtering in Gravitational Wave Detection
- Cross-Correlation and SNR Calculation
- Finding the Optimal Filter
- Defining Match Filter SNR
- Detection Statistics in a Bayesian Context
- Maximum Likelihood Ratio over Extrinsic Parameters
- Maximum Likelihood Ratio wrt to Amplitude, Phase and Time of Arrival
- Multiple Detectors
- Power Spectral Density (PSD) in Gravitational-Wave Data Analysis
- The Partial Scaling Interpolation Method
- Probability of Detection Calculation
- Horizon Distance
- ANN-based Pdet Estimation
- Hybrid Strategy for Spin-Precessing Systems
Examples:
- Optimal Signal to Noise Ratio (SNR) generation and comparison
- Contents of this notebook
- Requirements
- Below shows GWSNR initialization with all of its (default) arguments
- Noise-Weighted Inner Product
- Partial Scaling Interpolation
- Testing speed and accuracy between the interpolation method and inner product method.
- ANN-model and \(P_{\rm det}\) Estimation
- Hybrid SNR Recalculation for \(P_{\rm det}\) Estimation
- JAX assisted Inner product with
ripplegwas backend - Changing the initialization arguments
- Probability of Detection (Pdet) generation and comparison
- ANN Model creation and testing
- SNR Threshold Finder Example
- Horizon Distance Calculation with Mass-Dependent SNR Thresholds